CHAPTER 8 - Extension Components (Chart Components)
In the chapter about Google Sheets components, we saw components that generate charts. However, EZoApp actually provides independent chart components. As long as you feed JSON files to these chart components, they will create specific charts based on the JSON data.
Here are EZoApp's chart components:
| flot-pie | flot-bar | flot-stacking | flot-line | linechart |
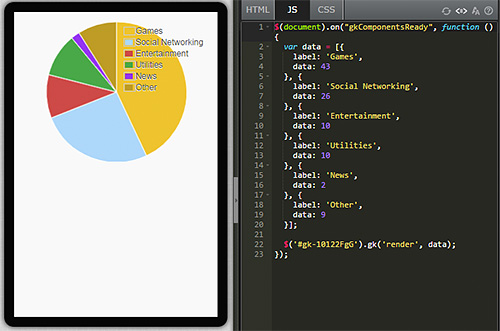
1. flot-pie

( Example: http://jqmdesigner.appspot.com/designer.html#&ref=6302137319424000 )
This component works exactly the same way as the google-sheets-chart-pie component. The only difference is that we need to manually enter JSON data in this component. Thus, after dragging-and-dropping the component onto the design screen, a section of JS code will be generated, and we just need to fill in the values here.
$(document).on("gkComponentsReady", function () {
  var data = [{
    label: 'Games',
    data: 43
  }, {
    label: 'Social Networking',
    data: 26
  }, {
    label: 'Entertainment',
    data: 10
  }, {
    label: 'Utilities',
    data: 10
  }, {
    label: 'News',
    data: 2
  }, {
    label: 'Other',
    data: 9
  }];

  $('#gk-109Y0VB').gk('render', data);
});
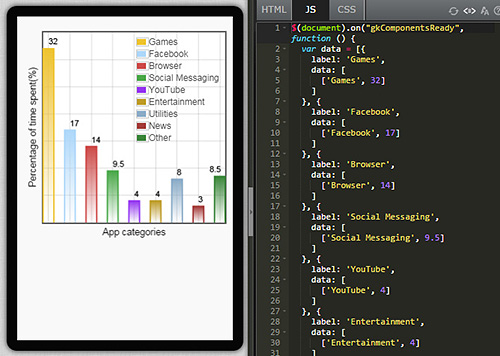
2. flot-pie

( Example: http://jqmdesigner.appspot.com/designer.html#&ref=4910055069581312 )
This component also works in the same way as the google-sheets-chart-car. Also, just like the flot-pie, when dragged-and-dropped onto the design screen, a section of JS code will be generated; manually add JSON files and it will generate a bar chart automatically.
$(document).on("gkComponentsReady", function () {
  var data = [{
    label: 'Games',
    data: [
      ['Games', 32]
    ]
  }, {
    label: 'Facebook',
    data: [
      ['Facebook', 17]
    ]
  }, {
    label: 'Browser',
    data: [
      ['Browser', 14]
    ]
  }, {
    label: 'Social Messaging',
    data: [
      ['Social Messaging', 9.5]
    ]
  }, {
    label: 'YouTube',
    data: [
      ['YouTube', 4]
    ]
  }, {
    label: 'Entertainment',
    data: [
      ['Entertainment', 4]
    ]
  }, {
    label: 'Utilities',
    data: [
      ['Utilities', 8]
    ]
  }, {
    label: 'News',
    data: [
      ['News', 3]
    ]
  }, {
    label: 'Other',
    data: [
      ['Other', 8.5]
    ]
  }];

  $('#gk-109BFPk').gk('render', data);
});
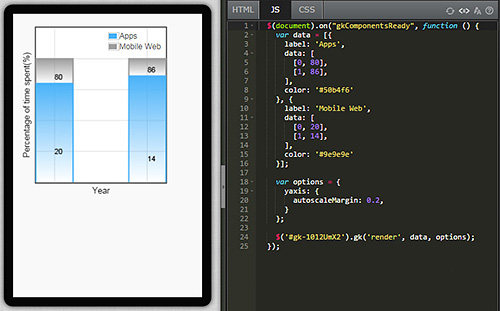
3. flot-stacking

( Example: http://jqmdesigner.appspot.com/designer.html#&ref=5162297425133568 )
Another type of bar chart is the kind with segments in the bars. It can display data in multiple dimensions. And, just like the previous components, dragging-and-dropping this component onto the design screen will generate a section of JS code; manually enter JSON data and you are done! (However, the JSON data will contain a matrix; after all, this is a "segmented" bar chart.)
$(document).on("gkComponentsReady", function () {
  var data = [{
    label: 'Apps',
    data: [
      [0, 80],
      [1, 86],
    ],
    color: '#50b4f6'
  }, {
    label: 'Mobile Web',
    data: [
      [0, 20],
      [1, 14],
    ],
    color: '#9e9e9e'
  }];

  var options = {
    yaxis: {
      autoscaleMargin: 0.2,
    }
  };

  $('#gk-109fZmj').gk('render', data, options);
});
4. flot-line

( Example: http://jqmdesigner.appspot.com/designer.html#&ref=4833882213974016 )
The use of a line chart is in fact the same as the pie chart and bar chart mentioned above- drag-and-drop the component onto the design screen and generate JS code, manually enter JSON data, and that's it! It can also create a line chart with multiple lines. The underlying principle is similar to that of flot-stacking.
$(document).on("gkComponentsReady", function () {
  var dataset_tv = {
    data: [
      [1, 45],
      [2, 44],
      [3, 43],
      [4, 42],
      [5, 38]
    ],
    label: 'TV'
  };

  var dataset_online = {
    data: [
      [1, 25],
      [2, 26],
      [3, 26],
      [4, 26],
      [5, 20]
    ],
    label: 'Online'
  };

  var dataset_radio = {
    data: [
      [1, 17],
      [2, 16],
      [3, 15],
      [4, 14],
      [5, 12]
    ],
    label: 'Radio',
    color: '#469a54'
  };

  var dataset_mobile = {
    data: [
      [1, 4],
      [2, 6],
      [3, 9],
      [4, 12],
      [5, 20]
    ],
    label: 'Mobile',
    labels: ["4%", "6%", "9%", "12%", "20%"]
  };

  var options = {
    xaxis: {
      autoscaleMargin: 0.5,
      ticks: [
        [1, 2009],
        [2, 2010],
        [3, 2011],
        [4, 2012],
        [5, 2013]
      ]
    }
  };

  $('#gk-109pNlg').gk('render', [dataset_tv, dataset_online, dataset_radio, dataset_mobile], options);
});

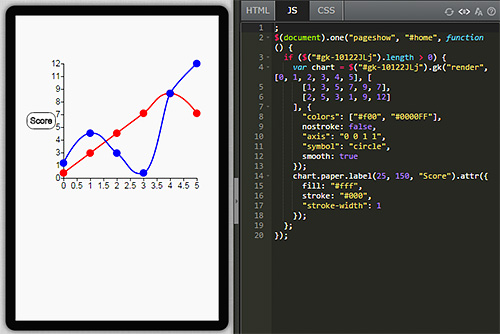
5. linechart

( Example: http://jqmdesigner.appspot.com/designer.html#&ref=4894762435870720 )
This last chart component also creates a line chart. linechart does not look as good as flot-line, but their methods of use are similar.
$(document).one("pageshow", "#home", function () {
  if ($("#gk-109sS5V").length > 0) {
    var chart = $("#gk-109sS5V").gk("render", [0, 1, 2, 3, 4, 5], [
      [1, 3, 5, 7, 9, 7],
      [2, 5, 3, 1, 9, 12]
    ], {
      "colors": ["#f00", "#0000FF"],
      nostroke: false,
      "axis": "0 0 1 1",
      "symbol": "circle",
      smooth: true
    });
    chart.paper.label(25, 150, "Score").attr({
      fill: "#fff",
      stroke: "#000",
      "stroke-width": 1
    });
  };
});
Continue reading CHAPTER 9 - Extension Components (Hardware Control Components)
Or Return to Table of Contents