CHAPTER 17 - 串接氣象資料做氣象 App (1)
看完了串接政府的開放資料後,接著要試著串氣象資料了,這篇會先介紹串中央氣象局資料,下一篇會接著介紹串接 yahoo 氣象資料和直接使用氣象元件。
來看到如何串接中央氣象局的資料,大家可以連到「中央氣象局資料開放平台」( http://opendata.cwb.gov.tw/index.htm ),就可以看到氣象局提供了很多觀測資料或預報資料,而中央氣象局也是目前更新最快最準的資料,畢竟台灣的氣象局是世界有名的呀!不過很鳥的是,然後我們先找一個簡單的測試:「雷達回波圖彩色產品-南台灣區域有地形」( http://opendata.cwb.gov.tw/observe/dataset/A0011-006.htm ),這個也是新聞報雨量最常用的,會看雷達迴波圖,就可以自己預測兩三個小時內是否會下雨。
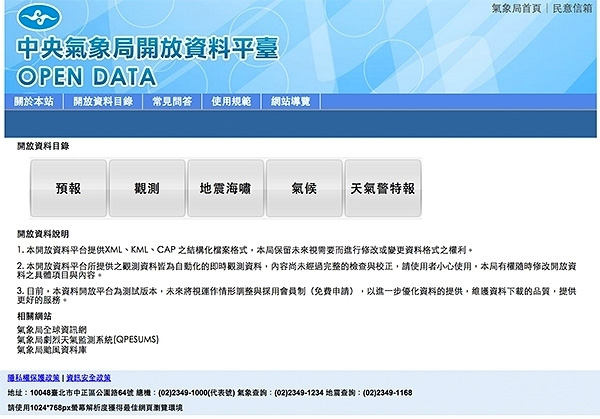
不過由於氣象局只提供 XML ( 都什麼年代了還只提供 XML ),因此這裡要獲取資料,就要使用 jQuery 的 ajax 來取得,當然,前提還是必須得跨域!之前有介紹如何跨域 ( 串接 JSON ),使用 chrome 安裝這個跨域小套件 『Allow-Control-Allow-Origin: *』,點選之後變成綠燈就可以跨域囉!而剛剛的氣象資料的 XML 網址是:http://opendata.cwb.gov.tw/opendata/DIV4/O-A0011-006.xml
因為 EZoApp 內建 jQuery,所以你可以直接使用 jQuery 的寫法,先來試試看用 ajax 能否獲取到氣象資料,在 JS 面板裡寫下:
$(function () {
  $.ajax({
    type: "GET",
    url: "http://opendata.cwb.gov.tw/opendata/DIV2/O-A0001-001.xml",
    dataType: "xml",
    error: function (e) {
      console.log('oh no');
    },
    success: function (e) {
      var xml = e;
      console.log($(xml));
    }
  });
});
個寫法在點選 preview 之後,如果有正確抓到 xml,則會在 console 秀出來,如果失敗,就會秀出 oh no~ 要看 console 在 windows 點選 f12,mac 則是 option+command+i 。
( 範例:http://jqmdesigner.appspot.com/designer.html#&ref=4864692967178240 )
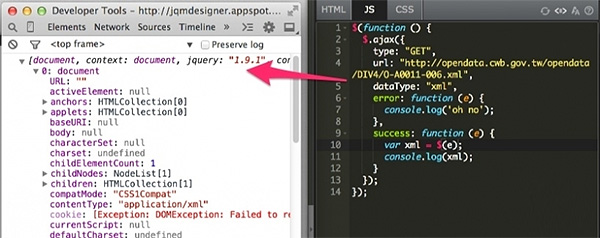
但因為 xml 進來的長相比較詭異,因此我們這邊要用一些小技巧來解決,也就是使用 「find」和「text()」來直接抓取 xml 節點資料,程式碼修改如下:
$(function () {
  $.ajax({
    type: "GET",
    url: "http://opendata.cwb.gov.tw/opendata/DIV4/O-A0011-006.xml",
    dataType: "xml",
    error: function (e) {
      console.log('oh no');
    },
    success: function (e) {
      var time = $(e).find('obsTime').text();
      var img = $(e).find('uri').text();
      console.log(time);
      console.log(img);
    }
  });
});
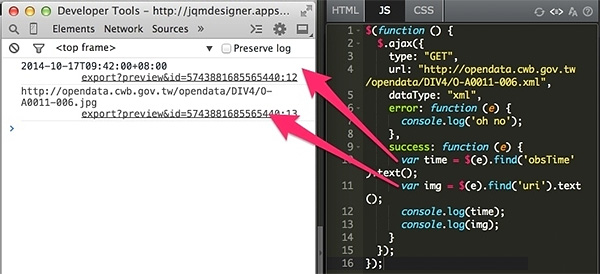
點選 preview 之後,發現已經抓到時間和圖片了!
( 預覽:http://jqmdesigner.appspot.com/designer.html#&ref=6273799259422720 )
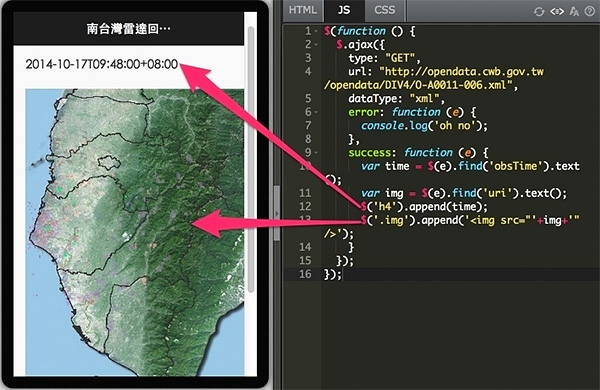
既然已經抓到了,那就直接改一下程式,讓它秀在畫面上吧!
( 預覽:http://jqmdesigner.appspot.com/designer.html#&ref=5748219279572992 )
HTML:
<div id="home" data-role="page">
  <div data-role="header" data-position="fixed" data-theme="b">
    <h3>南台灣雷達回波圖</h3>
  </div>
  <div role="main" class="ui-content">
    <h4></h4>
    <div class="img"></div>
  </div>
</div>
javascript:
var time = $(e).find('obsTime').text();
var img = $(e).find('uri').text();
$('h4').append(time);
$('.img').append('<img src="'+img+'"/>');
會串接雷達回波圖之後,就來點比較有難度的好了,來做一個『具有下拉選單,選擇地點看該地點的氣象資訊』,在中央氣象局的網站我們選擇氣象觀測的資料:http://opendata.cwb.gov.tw/observe/dataset/A0001-001.htm,由於內容非常多,我們先來看看氣象局提供的說明 pdf:http://opendata.cwb.gov.tw/opendatadoc/DIV2/A0001-001.pdf,看起來我們需要的資料是:CITY(縣市)、TOWN(鄉鎮)、TEMP(溫度)、HUMD(濕度)、WDSD(風速)、H_24R(日累積雨量)、OBS_TIME(觀測時間)
首先要抓取總共有幾筆資料,正確讀取的話,console.log 裡應該可以看到 60 ( 不確定是否會隨時間變動 ):
$(function () {
  $.ajax({
    type: "GET",
    url: "http://opendata.cwb.gov.tw/opendata/DIV2/O-A0001-001.xml",
    dataType: "xml",
    error: function (e) {
      console.log('oh no');
    },
    success: function (e) {
      var num = $(e).find('location').length;
      console.log(num);
    }
  });
});
然後測試一下能否讀到內容,看起來應該滿順利就可以讀到內容,這裡用的方法其實就只獲取第幾個 data 裏頭的值而已,因為 data 已經是 jquery 的變數,因此就要使用 data.eq(i) 的方法獲取,而不是用 data[i]。
( 預覽:http://jqmdesigner.appspot.com/designer.html#&ref=6297908722794496 )
$(function () {
  $.ajax({
    type: "GET",
    url: "http://opendata.cwb.gov.tw/opendata/DIV2/O-A0001-001.xml",
    dataType: "xml",
    error: function (e) {
      console.log('oh no');
    },
    success: function (e) {
      var data = $(e).find('location');
      var num = data.length;
      var time = data.eq(0).find('time').text();
      var city = data.eq(0).find('parameter').eq(0).find('parameterValue').text();
      var town = data.eq(0).find('parameter').eq(2).find('parameterValue').text();
      console.log(time);
      console.log(city);
      console.log(town);
    }
  });
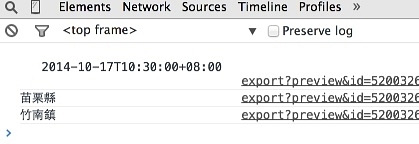
既然可以順利讀到資料,再來就把資料丟到 listview 裡頭去吧!這裡把上面的 option 改成 listview,因為資料量大,listview 比較好閱讀,然後因為有使用 jqm 的 listview 元件 API ( refresh,讓動態塞入的資料可以套用 jqm 格式 ),所以也順便把 JS 的寫法改成 jquery mobile 的寫法,不過主程式完全一樣。
( 預覽:http://jqmdesigner.appspot.com/designer.html#&ref=4840133538873344 )
HTML:
<div id="home" data-role="page">
  <div data-role="header" data-position="fixed" data-theme="b">
    <h3>台灣即時氣象</h3>
  </div>
  <div role="main" class="ui-content">
    <ul data-role="listview" data-inset="true" id="menu">
      <li data-role="list-divider">點選城市<i class="time"></i></li>
    </ul>
  </div>
</div>
javascript:
(function () {
  $(document).on("pageshow", "#home", function () {
    $.ajax({
      type: "GET",
      url: "http://opendata.cwb.gov.tw/opendata/DIV2/O-A0001-001.xml",
      dataType: "xml",
      error: function (e) {
        console.log('oh no');
      },
      success: function (e) {
        var i;
        var $menu = $('#menu');
        var data = $(e).find('location');
        var num = data.length;
        var time = data.eq(0).find('time').text();
        for (i = 0; i < num; i++) {
          $menu.append('<li><a href="#">' +
            data.eq(i).find('parameter').eq(2).find('parameterValue').text() +
            '</a></li>').listview('refresh');
        }
      }
    });
  });
})();
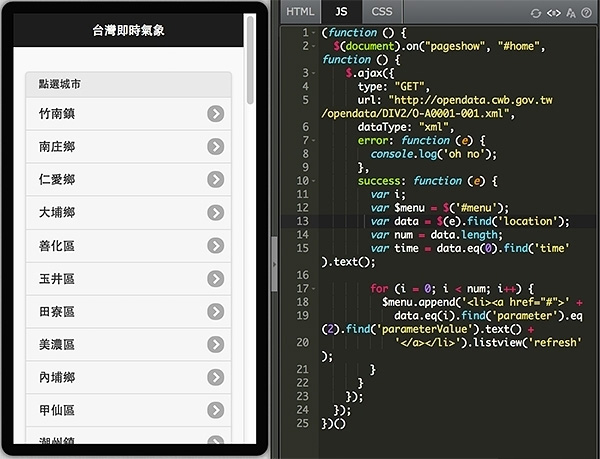
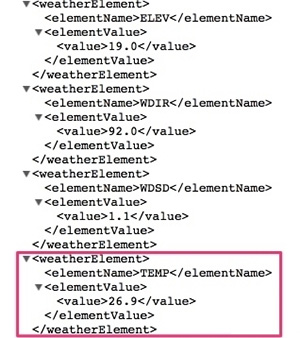
資料丟進去之後還不稀奇,現在要跟上一篇的地圖一樣,點選之後秀出資訊,因此我們要先建立一個新的頁面,叫做 detail,然後再寫一些 JS,讓點選時可以對應到該城鎮的氣象資訊,關於建立新頁面不了解的,可以回頭看一下前一篇建立地圖的頁面,做法一模一樣噢!在這邊要注意的是,因為出來的 xml 標簽名稱很多重複,因此變成要看順序,這也是為什麼用了很多 eq 的原因啦!
( 範例:http://jqmdesigner.appspot.com/designer.html#&ref=4840418885763072 )
HTML ( #home ):
<div id="home" data-role="page">
  <div data-role="header" data-position="fixed" data-theme="b">
    <h3>台灣即時氣象</h3>
  </div>
  <div role="main" class="ui-content">
    <ul data-role="listview" data-inset="true" id="menu">
      <li data-role="list-divider">更新:<i class="time"></i>
      </li>
    </ul>
  </div>
</div>
HTML (#detail ):
<div id="detail" data-role="page" is="page">
  <div data-role="header" data-position="fixed" data-theme="b">
    <h3>Header</h3>
    <a class="ui-btn ui-btn-left ui-icon-arrow-l ui-btn-icon-notext" data-rel="back">Button</a>
  </div>
  <div role="main" class="ui-content" is="content">溫度:
    <span class="temp"></span>度C
    <br>濕度:
    <span class="humd"></span>百分比
    <br>風速:
    <span class="wdsd"></span>公尺/秒
    <br>日雨量:
    <span class="h24r">毫米</span>
  </div>
</div>
javascript:
var temp, humd, wdsd, h24r, name;
(function () {
  $(document).on("pageshow", "#home", function () {
    $.ajax({
      type: "GET",
      url: "http://opendata.cwb.gov.tw/opendata/DIV2/O-A0001-001.xml",
      dataType: "xml",
      error: function (e) {
        console.log('oh no');
      },
      success: function (e) {
        var i,
          $menu = $('#menu'),
          data = $(e).find('location'),
          num = data.length,
          time = data.eq(0).find('time').text();
        $('.time').append(time);

        for (i = 0; i < num; i++) {
          $menu.append('<li><a href="#detail">' +
            data.eq(i).find('parameter').eq(2).find('parameterValue').text() +
            '</a></li>').listview('refresh');
        }

        $('li a').on('click',function(){
          var aIndex = $(this).parent('li').index()-1;
          temp = data.eq(aIndex).find('weatherElement').eq(3).find('elementValue').text();
          humd = data.eq(aIndex).find('weatherElement').eq(4).find('elementValue').text();
         h24r = data.eq(aIndex).find('weatherElement').eq(7).find('elementValue').text();
         wdsd = data.eq(aIndex).find('weatherElement').eq(2).find('elementValue').text();
         name = $(this).text();
        });
      }
    });
  });
})();

(function () {
  $(document).on("pageshow", "#detail", function () {
    $('.temp').append(temp);
    $('.humd').append(humd);
    $('.h24r').append(h24r);
    $('.wdsd').append(wdsd);
    $('h3').text(name);
  });
})();
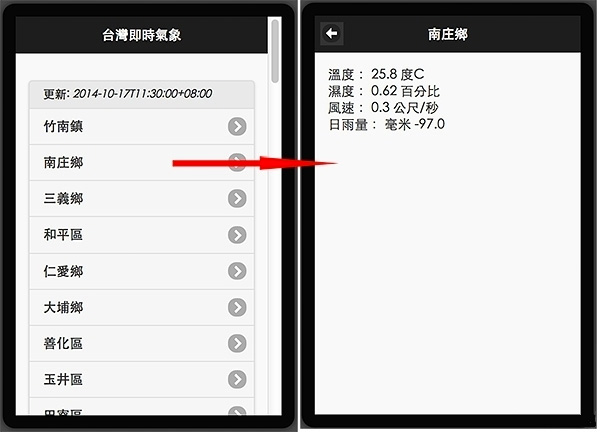
就這樣,大功告成!只要 export APK,你就已經做完了一個即時氣象的 App 了,不過,還少很多使用者體驗和美化了,但有沒有發現,其實很容易呀!下篇會繼續介紹其他串氣象的用法。
(範例:http://jqmdesigner.appspot.com/designer.html#&ref=5966318792605696 )